Nexiga Maps | Digital Maps
Our market and geodata contain a wide range of information on customers, target groups, locations and markets. Nexiga Maps visualizes this in simple and clear digital maps such as Geostreet+.
In addition to street names, traffic routes and house number ranges, numerous points of interest and land use information are available, providing a comprehensive view of regional conditions. This means that the results of geographical analyses can be quickly compared and evaluated.
Nexiga Map is available worldwide on the basis of navigation data from the market leader TomTom and data from OpenStreetMap (OSM).
The digital vector maps can be integrated into both desktop systems and cloud services.
Digital maps - centrally created, available worldwide
Zooming, defining sections, displaying distances, printing - our digital vector maps are far superior to any table or graphic. With our maps, you have an overview of all regional conditions and can compare the results of geographical analyses quickly and easily. Four display variants and additional geographical information such as building perimeters and contour lines are available.
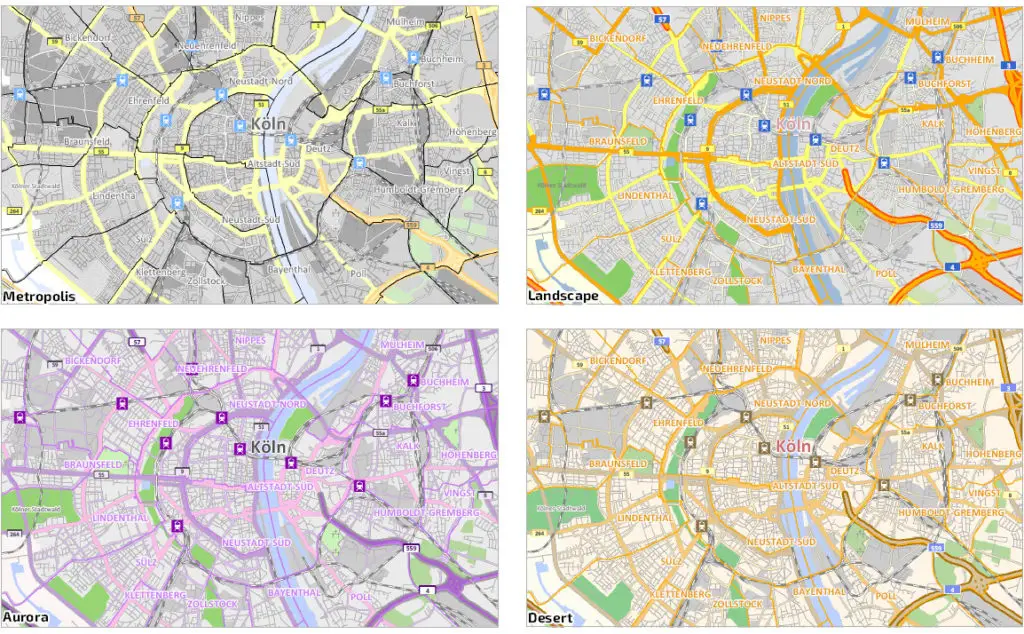
Description of the color variants
Our digital maps can be easily exported or transported in the form of data via cloud services. In addition, Nexiga Maps are available worldwide based on navigation data from the market leader TomTom - with razor-sharp zoom levels. This makes it possible to calculate areas, locations or routes anytime and anywhere.
With Nexiga Maps, the complete geodata portfolio, including all traffic routes, street names and house number ranges, is available to you without limits for geocoding. In addition, the digital maps contain numerous points of interest and land use information that support you in your marketing planning.
All content is stored on the digital vector maps in the form of coordinates, which represent points (railroad stations and points of interest), lines (roads and rivers) or areas (woodland or settlement areas). Together, all the information results in a map image that can be optimized depending on the zoom level or map section.
-
Metropolis: The main traffic routes are visualized in yellow and orange tones, parks in light green. Settlement areas or commercial areas in shades of gray.
-
Aurora: The main traffic routes and points of interest are visualized in violet and purple tones, parks in lush green.
-
Landscape: Here the traffic routes are displayed in stronger yellow and orange tones.
-
Desert: The main traffic routes are depicted in strong autumn colors. Settlement areas are sand-colored.
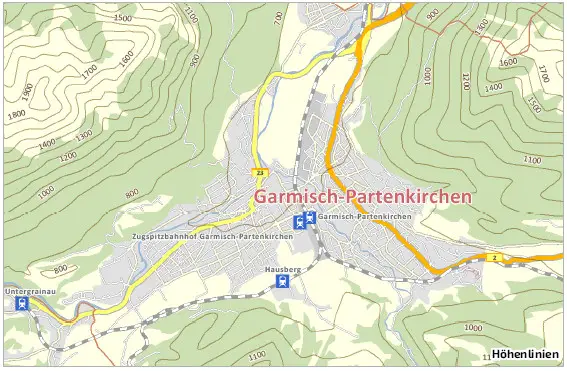
Contour lines and building perimeters
With additional information such as the building per imeters(house perimeters), for example, the building structure in many larger German city centers is illustrated. Contour lines show the local topographical conditions. You can find many more examples of mapping and digital maps in our News section. Why not take a look?