
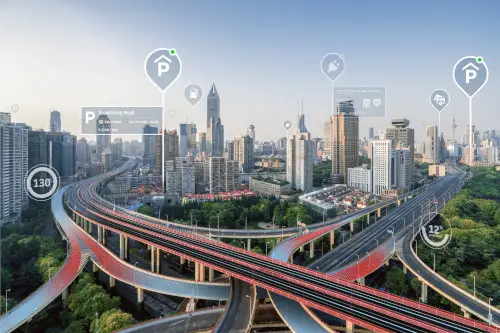
Local traffic intensity or density is an important location factor for the attractiveness of locations, particularly in the retail and services segments.
The Traffic Density product based on real traffic data from TomTom, the well-known manufacturer of geodata and navigation devices from the Netherlands, provides a reliable data package for location analyses. After all, in addition to the accessibility of a location, relevant traffic is also a guarantee for the visibility and perception of a brand in everyday life. However, the data is also interesting for other sectors.
Transportation and traffic
News from the economy
But first to the latest business news: Many people may not have heard of the new company with the artificial name Stellantis. But behind it is the world's fourth-largest car manufacturer with a total of 14 brands. It has only existed since mid-January 2021, created through the merger of the French PSA (including Peugeot, Citroen, Opel) and the Italian-Canadian FCA (Fiat, Alfa Romeo, Chrysler/Jeep). According to its own figures, the PSA Group alone has a market share of around 9.7% in Germany (2020). Together with Fiat & Co., there is therefore a significant fleet on our roads, which also plays a corresponding role in the recording of traffic flows (real measurements) by the company TomTom.
Speaking of TomTom: the location technology specialist from the Netherlands recently teamed up with Uber to introduce maps, traffic data and technology to the ridesharing giant 's global platform. On the other hand, Uber supplies valuable geodata (routing, fares, arrival times, etc.) back to TomTom. As Uber's core business, i.e. the disruptive cab business, has plummeted due to the pandemic, new business areas need to be developed. Delivery services are booming, which is why the company acquired Drizly in January, a kind of Amazon for alcoholic beverages in the USA and Canada, which is to be integrated into the UberEats segment (food delivery). Drizly's margins are also likely to be high, as alcohol consumption rose significantly in many countries last year.
Stellantis and Uber are examples of global companies whose activities - in terms of traffic - flow into geodata such as Traffic Density from TomTom, among many other data sources.
TomTom offers even more comprehensive traffic data via its Move portal, including detailed traffic statistics (called TrafficStats). This data enables even more comprehensive reporting for locations. The variety and depth of data is so extensive that we will soon be covering this topic in a separate blog.
"The world has changed, traffic has changed."
What does it have to do with Traffic Density is all about? The product is part of the traffic analysis services TomTom's traffic analysis services, which are created by combining several data sources are created. This includes anonymous measurements from the well-known GPS navigation devices, from motor vehicles in general and from commercial fleets (rental cars), but also from smartphones and sensor data from public authorities. Worldwide more than 600 million GPS devices contribute to TomTom Traffic, all collected anonymously, as TomTom's architecture is based on privacy by design is based on Privacy by Design. Data protection requirements and data security are already checked and implemented during the development phase of the technology.
Traffic density as an indicator of traffic volume
With this extensive data, TomTom was able to identify a significant decrease in traffic congestion worldwide in 2020 due to lockdown measures as a result of the pandemic and changes in people' s behavior. This phenomenon was observed in 387 out of 416 cities. The TomTom Traffic Index provides interesting insights into this. For example, the Moscow region is currently the world congestion champion, followed by Mumbai (India) and Bogotá (Colombia). In the few German cities such as Berlin and Hamburg, on the other hand, traffic flows relatively smoothly: They are only in 59th and 61st place in the global ranking.
Unadulterated data
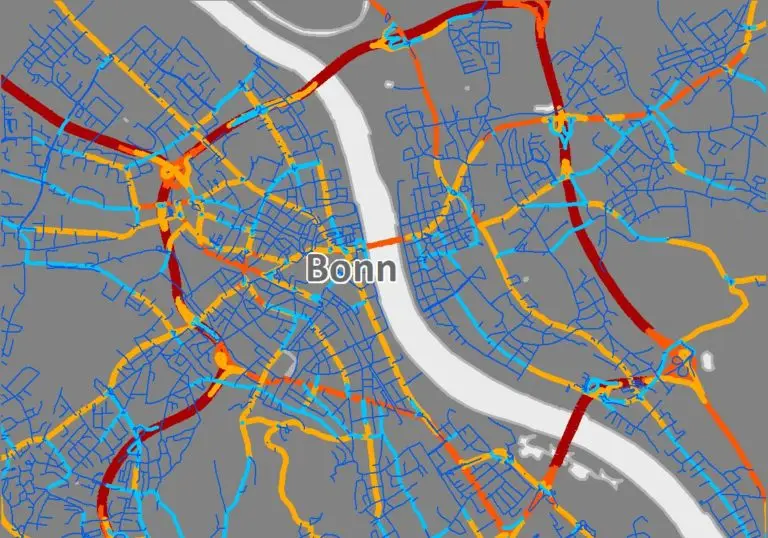
The decline in traffic is also reflected in the traffic density data that Nexiga has processed across Germany (data as of summer 2020). They represent the recorded traffic data from the last 12 months. Real values of the measured vehicles are shown for all relevant road segments: For each day of the week, the average of the days of the week and for many segments also to the hour (24/7). The data is unadulterated and is not extrapolated to total traffic. However, a large proportion of German drivers are already connected and provide valuable anonymized data that can be relevant for many location intelligence issues, especially for evaluating locations.
Traffic density in practice
The traffic density data thus provides a good indication of the relative traffic volume over a period of 12 months for many millions of road segments in Germany alone.
Possible applications are
-
Petrol station and car wash operators: Planning of new locations taking into account valid traffic data.
-
E-mobility: development and expansion of (fast) charging stations and charging infrastructure.
-
Mobility providers and transport planners: planning car sharing, rental car stations or parking spaces for e-scooters.
-
Fitness studios: Rollout of new locations. Optimization of the existing network.
-
Restaurants/Dining: Expansion planning.
-
DIY and leisure stores: planning new locations.
-
Out-of-home media: planning of poster sites, scheduling for advertising campaigns.
-
Telecommunications: Planning the 4G/5G infrastructure.
-
Parcel service providers: planning of PUDOs (pick-up and drop-off points) such as packing and parcel stations, stores, kiosks.
Our round and colorful world will certainly continue to change constantly in the future . Real-time data or even real-time data, such as from the transport sector, will therefore become increasingly important for location assessment.