
Nordbrücke Bonn: Data Shows Massive Shift in Traffic Following the Closure
The closure of Bonn’s Nordbrücke and its impact on traffic conditions—especially during rush hour—are a source of concern for drivers, businesses, commuters, and travelers in the greater Bonn area. Today, such developments can not only be observed but also precisely measured.
Our map clearly shows, in this specific case, where traffic is shifting as a result of the closure and which changes in the road network are particularly noticeable.
Would you like to know how traffic measures, construction projects, or infrastructure changes affect your region?
Contact us— we’ll support you with in-depth mobility analyses based on historical and current traffic data, as well as powerful geographic analyses.
Where Traffic Flows Today
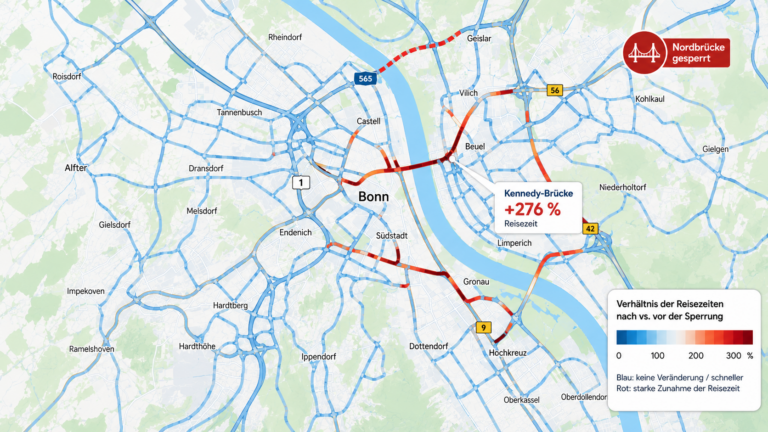
The comparison map shown below illustrates the difference in travel times before and after the closure. The darker the red color of a road segment, the greater the increase in travel time.
The development is particularly noticeable at the Kennedy Bridge, which connects downtown Bonn with the Beuel neighborhood and is located about two kilometers south of the Nordbrücke.
The analysis shows:
- Travel times up to 276% higher than before the closure
- Average speed dropped from 47 km/h to 17 km/h
- Vehicle traffic has more than doubled
The map clearly shows that traffic volume is not simply reduced, but rather shifted to alternative Rhine crossings and adjacent road networks. At the same time, traffic on numerous feeder roads is also significantly increased.
Using TomTom Traffic Stats, we analyze, among other things:
-
Travel Times
-
Average Speeds
-
Traffic volume
-
Changes in Traffic Volume
-
Trends Over Time
This makes it possible to objectively assess infrastructure projects, construction sites, or road closures and to visualize their impact on the transportation network.
As a long-standing partner of navigation specialist TomTom, Nexiga has direct access to one of Europe's largest historical road databases.
Ratio of Travel Times
Nexiga analyzed traffic flows as an example during the time window between 6:00 a.m. and 9:00 a.m. on a Tuesday, both before and after the closure of the Bonn North Bridge.
The map shows how traffic is shifting geographically as a result of the closure and what impact this has on the existing road network.

Fig.: Comparison of travel times between 6:00 a.m. and 9:00 a.m. before (June 2, 2026) and after (June 9, 2026) the closure of the Bonn North Bridge. Dark red road segments indicate the greatest increases in travel time (Source: TomTom’s Move Portal)
Mobility Data - A Key Component
Today, mobility data is a key component in data-driven decisions regarding location and infrastructure. It provides detailed information about traffic and movement patterns and can be combined with market, geographic, and structural data. This enables reliable analyses for municipalities, transportation planners, the real estate industry, the retail sector, and energy providers.
In addition to traffic volumes, factors such as commuter flows, catchment areas, or hotspots can be identified and visualized spatially.
Current events such as the closure of the Bonn Nordbrücke bridge clearly demonstrate the added value of data-driven analysis: rather than relying on subjective impressions, changes in the transportation network become measurable and traceable. This creates a reliable foundation for planning, communication, and future mobility concepts.
25.06.2026
Dirk Schneider is the CEO of Nexiga GmbH and an expert in location intelligence, location analysis, and data-driven decision-making. He has been with Nexiga for over 18 years and, as CEO, has shaped the company’s strategic development for more than a decade. In this role, he helps clients in the private and public sectors derive valuable insights from spatial information to inform their planning and business processes.