Visualize market analyses online faster
Quickly and flexibly find the most lucrative locations for your business.

The web app knows where your customers are.
Are you planning to open a branch in an attractive location? Or do you want to know where the greatest customer potential for your sales department is located? No problem. With the Market Analyst online, you can quickly and easily determine your customer and sales potential across different distance zones.
Your advantages
- Latest data
- Full market transparency
- Flexible online access
- Ready-to-Go System
- Fastest results
Analyze target groups and determine customer potential - easily online!
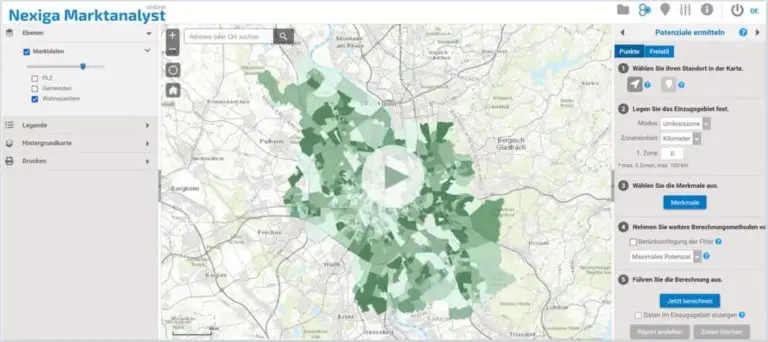
The Nexiga market analyst online saves you cost-intensive market research. Information on customer potentials or target group distributions based on catchment areas according to travel times or distances as well as individual locations, areas or sales territories are provided within seconds in the form of a vivid map visualization. Important data correlations become visible at a glance and provide a sound basis for confident decisions.
Looking for relevant market data for site planning and expansion planning?
Probably the most uncomplicated and flexible way to perfect your location planning and location analysis based on meaningful market data is right in front of you. With just a few clicks, you can identify online the customer potential and sales opportunities for entire sales territories or individual locations. Fast. Flexible. Inexpensive.
Nexiga Market Analyst online gives you access to decision-relevant geodata and market information via an online account. At any time. At any place.
What our customers say:
Thanks to its ease of use, you save valuable time and can also always refer to an industry-recognized source in negotiations."


PRODUCT VARIANTS
Choose the variant that exactly meets your business requirements. Thanks to helpful functions, intuitive handling and a variety of powerful features, the geoinformation system is a reliable and professional analysis tool in the eyes of many users. You can get a cost-effective start with the SINGLEor TEAM version. The individual ENTERPRISE solution offers you maximum flexibility.
| Product variant | SINGLE | TEAM | ENTERPRISE |
|---|---|---|---|
| Users | From 1 user | From 5 users | individual/unlimited |
| Terms | from 3 months | 12 months | 12 months |
Basic data
|
5 variables | 5 variables | flexible |
| Storage volume | 1 GB | 10 GB | flexible |
Functions
|
✔️ | ✔️ | ✔️ |
| Layer Sharing | X | ✔️ | ✔️ |
| User management | X | X | ✔️ |
| Customizing
We customize the system to your individual needs on request (as a service). Ask us about further functions and possibilities. |
X | ✔️ | ✔️ |
| Software installation | X | ✔️ | available as desktop version |
| Streaming services
Connection to Nexiga server with simple data exchange (on demand) possible on request. |
X | X | ✔️ |
| Data pool
Are you interested in further data characteristics? No problem - just ask us! |
X | X | Search data online |
Use Cases

Find destinations
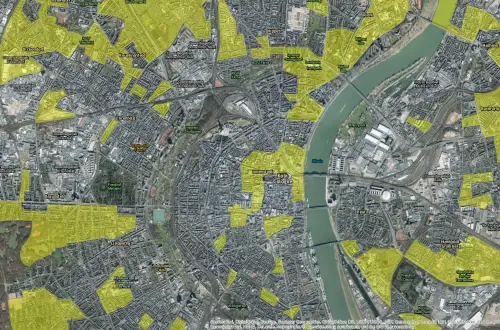
In which regions can you find the right target group? Which zip codes have a young population and above-average purchasing power?
Simply filter the appropriate market data in the table and transfer the selection directly to the map.
Visualize customers
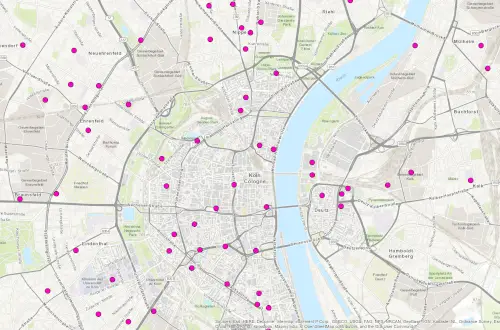
How are your customers distributed spatially and are there any discernible geographical patterns? Where do interesting potential areas arise in comparison to purchasing power?
Import the address list of your existing customers into the system - they will be assigned a coordinate ad hoc and displayed directly on the map for your analysis.
Compare locations
Which potential location offers the most favorable environment?
Determine the potential per location on the basis of catchment areas: number of inhabitants and households, average purchasing power or number of companies in an industry. All market data is available for analysis at various geographical levels (residential districts, zip codes or municipalities).
45 minutes practical application
Get to know our web app better and watch our webinar.
We will show you how to display your location or customer addresses directly on the map and determine meaningful potential for existing and potential locations based on catchment areas with just a few clicks.
Using the integrated Nexiga market data at various geographical levels, lucrative expansion areas or the spatial distribution of target groups become immediately visible. Different locations can be visualized with the most important information and compared directly with each other.
Questions about our solutions?
Do you need a results-oriented solution for your industry? Are you looking for specific data characteristics or would you like to receive more information? Then simply use our contact form. We are looking forward to your questions!


