
The Esri User Conference will open its virtual doors from July 12-15, 2021. This means that San Diego, California, will remain a long way off for many GIS enthusiasts this year.
But despite an imaginary 9,244 km as the crow flies (Bonn - San Diego) and a 9h time change, our Nexiga night owls are ready to learn a lot of new things from Esri and the ArcGIS product family during these three days.
Market data from Nexiga in ArcGIS Online
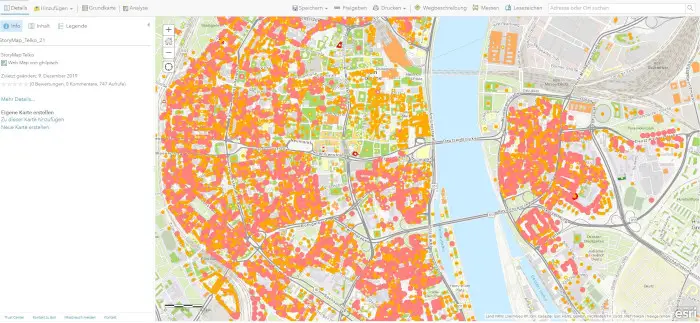
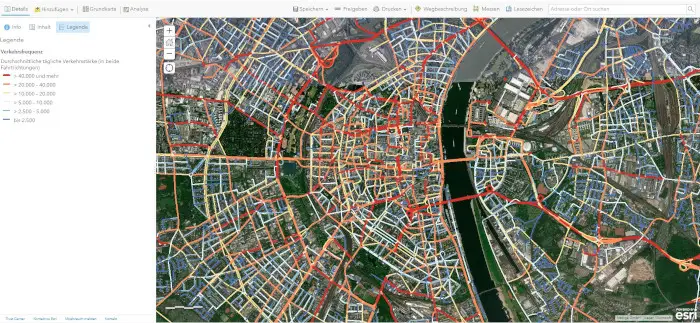
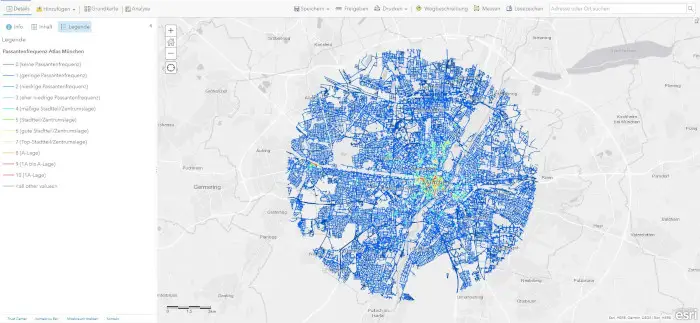
ArcGIS Online, a comprehensive, cloud-based mapping platform including Nexiga data, provides access to a wide range of spatial data. As an official data partner of Esri, numerous Nexiga market data attributes are available to its users on ArcGIS Online for analysis purposes.
EXAMPLES: Demographics (residents, households), purchasing power, footfall, centrality (retail), building and company data and target groups such as DINKS or yuppies.
In addition to the classic desktop applications, the platform offers many possibilities and is being continuously expanded. Information is displayed using dynamic and interactive maps, diagrams and tables (infographics). This allows dominant characteristics and key factors of a region to be quickly identified and shared with other users or groups.
We are therefore particularly excited to see what innovations Esri will be presenting at the Esri UC International User Conference next week.
What does GIS stand for?
GIS is the abbreviation for geographicinformationsystem. This refers to software solutions in which geographical data can be compiled, visualized and analysed for a specific task.
Our big world is modeled in many small levels (also called layers). These can be points that represent customers or individual buildings, or lines that represent road sections or other network connections. Information mapped in areas is referred to as geodata. They function via zip codes, municipalities or sales regions, for example. A GIS is therefore always asked spatial questions such as:
- Which customers are in a particular sales region and how high is their turnover?
- Where is market penetration higher than average - and what could be the reason for this?
- Which companies from sector X with a certain company size are there within a radius of 50 km?
Geodata is often used for the spatial creation of potential or target group analyses and are always closely linked to the corresponding market data. This makes it possible to analyze how many households live in a Municipality or how high the new customer potential is in an area that has not yet been developed. Market data describe both sales markets and procurement markets.
Spatially identical "twin areas"
If you want to know the socio-demographics, purchasing power or spatial conditions of your own customer base in their neighborhood, you can quickly determine this using a GIS and by linking your own data with geo and market data(data enrichment). This identifies spatial "twin areas" that offer new potential for the company as they are similar to the residential area of its own customers.
So if you know where to find your customers in Hamburg, you can just as easily transfer this to Munich, Stuttgart or Berlin thanks to Nexiga's geographical structure and know-how.